CPU-only LLM Inference
In this article, we’ll be putting our second-hand AMD Threadripper 1950x to some inference tests 🔥 - can you already smell some overheated plastic? No? That’s because the be quiet! is at the heart of our QuietBee 🐝😎
Quick intro - Niche AI trajectory
Alright, let’s take a step back - we’ve built the base for our AI home-lab (called QuietBee) - but as long as the GPU’s aren’t here yet - QuietBee just sits there without any work 😟. However, while doing some Nichebench testing - we had to use some local models - and we did run some random non-optimized CPU inference on the QuietBee - and it was quite okay (yielding 5-10 tokens, depending on the model).
But wait. Why are we doing this at all, you’re asking? I got you → we’re on our path to build open-weight Niche AI models - fine-tuned flavors that can perform exceptionally well, in niche domains, think: Drupal, Wordpress, Laravel, etc. We started the series with this super tiny fine-tuning experiment, and we’re still experimenting.
Alright, now that you’re up to speed - let’s dive into the article. Specs for the rest of the article: we’re running AMD Threadripper 🧵 1950x with 94 GB of RAM (I need 32 GB more to make it full quad-channel). I also capped CPU at 3.6 Ghz - this is important, I’m NOT running full-speed, reasons is that my PSU can’t take it - it’s pending to be changed next month 🤫
So, our results are RELATIVE, also the article is less about the results and more about the knobs, compilations and approach.
Targets: 🧠 What you’re actually optimizing for
We’ll be using for most of the things llama.cpp and a CPU-specific fork.
When you build llama.cpp, you get → llama-bench executable. You can use it to run benchmarks.
There are 3 metrics we can use:
- Prefill (pp) - how fast the model processes your prompt (input). Matters for RAG, retrieval, few-shot, and long-context summarization. In our case - we care, as usually in programming we do give a LOT of context.
- Decode (tg) - how fast the model generates (output). Matters for chatbots, code completion, streaming.
- Mixed (pp+tg) - a combined test that’s closer to real-world workloads (both long prompts and continuous generation).
When turning various knobs on CPU - you will optimize for one of these metrics, it’s rare when you can bump all 3 at the same time.
Here’s a sample output:
nikro@quietbee:~/projects$ ./ik_llama.cpp/build/bin/llama-bench --model ./models/gpt-oss-20b-Q4_K_M.gguf -t 16 -ngl 0 -pg 256,512 | model | size | params | backend | threads | test | t/s | | ------------------------------ | ---------: | ---------: | ---------- | ------: | ------------: | ---------------: | | gpt-oss ?B Q4_K - Medium | 10.81 GiB | 20.91 B | CPU | 16 | pp512 | 87.92 ± 1.70 | | gpt-oss ?B Q4_K - Medium | 10.81 GiB | 20.91 B | CPU | 16 | tg128 | 16.25 ± 0.18 | | gpt-oss ?B Q4_K - Medium | 10.81 GiB | 20.91 B | CPU | 16 | pp256+tg512 | 21.44 ± 0.40 |
Also:
- Different models behave differently - in all my tests we used the same model: openai/gpt-oss-20B @ Q4
- Different quantizations also behave differently - to dive deep into the rabbit-hole see this discussion.
- Apparently allocating what CPU cores / memory your runs use - also can increase fidelity / stable generation speeds.
Process & knobs: 🔧 What we tuned and how
🛠️ Build variants:
These are various build-types - different sources (i.e. original vs fork) - and different build flags, before running the compilation:
- Vanilla - a simple llama.cpp build - default CPU flags - reference here;
- BLAS / BLIS - enabled optimized linear algebra - same reference as above - sometimes these help in token generation (output), but by a little;
- IK native - ik_llama.cpp - built with flag
march=native
(could not enable FANCY SIMD still) - this is a fork of llama.cpp with special optimized knobs here and there. - … various other combinations and flags you can try out.
🎛️ Runtime knobs
- Threads – scaling beyond 16 cores didn’t help decode, 14-16 was best.
- NUMA – this controls which CPU / Memory slots are used.
- uBatch and Batch – playing with this knob can increase performance by a little.
- KV cache –
q8_0/f16
was the biggest decode (output) win (but not in ik_llama though) - Flash Attention – modest prefill boost (~3–5%), no decode gain (there are also flavors)
The process overall looks like this - step-by-step of sorts:
- You clone the llama.cpp (or ik_llama.cpp);
- You read the docs on how to run a BUILD - get all the dependencies installed;
- You run the build → get your
build/bin/llama-bench
- You can now run the bench with various parameters / knobs.
After experimenting A LOT, we realized that for this to be done reliably, due to small variances here and there, it’s better to create a wrapper shell command and run a bulk batch, and then compare the runs.
The normal 1 run output looks something like:
nikro@quietbee:~/projects$ ./ik_llama.cpp/build/bin/llama-bench --model ./models/gpt-oss-20b-Q4_K_M.gguf -t 16 -ngl 0 -pg 256,512 | model | size | params | backend | threads | test | t/s | | ------------------------------ | ---------: | ---------: | ---------- | ------: | ------------: | ---------------: | ======================================= HAVE_FANCY_SIMD is NOT defined | gpt-oss ?B Q4_K - Medium | 10.81 GiB | 20.91 B | CPU | 16 | pp512 | 87.92 ± 1.70 | | gpt-oss ?B Q4_K - Medium | 10.81 GiB | 20.91 B | CPU | 16 | tg128 | 16.25 ± 0.18 | | gpt-oss ?B Q4_K - Medium | 10.81 GiB | 20.91 B | CPU | 16 | pp256+tg512 | 21.44 ± 0.40 |
Here you get the 512 tokens prefill (input processing), 128 tokens decoding (output generation) and a mixture of 256 prefill + 512 generation.
By going back and forward, we ended-up having a huge table of these runs, and it got very hard to compare stuff. So, we decided to code (with some help from Claude) a llama-bench wrapper - https://github.com/HumanFace-Tech/hft-cpu-test/ - this tool 🛠️ allows you to:
- Run basic computer/setup checks ✅
- Define a config.yml for 🔭 exploratory (superficial) setups you want to explore…
- Run these in one batch and get a final comparison output 📊
- Use the output from exploratory run → to create a more in-depth run (check more knobs) to find the ultimate configs for best runs 🎯
Looks something like:
(venv) nikro@quietbee:~/projects/hft-cpu-test$ ./run_bench.sh configs/qb-exploratory.yaml 🔍 Pre-flight checks... 🚀 Starting benchmark harness... 📊 Report directory: reports/2025-10-15-182000-exploratory 🚀 Starting EXPLORATORY benchmark run 📋 Test matrix: 36 unique configs × 2 reps = 72 runs [1/36] vanilla / all_cores_16t_01 / pp512 Rep 1: numactl -N 0,1 -m 0,1 --physcpubind=0,1,2,3,4,5,6,7,8,9,10,11,12,13,14,15 /home/nikro/projects/llama.cpp/build-vanilla/bin/llama-bench -m /home/nikro/projects/models/gpt-oss-20b-Q4_K_M.gguf -p 512 -n 0 -o json -t 16 ✓ 56.880251 t/s Rep 2: numactl -N 0,1 -m 0,1 --physcpubind=0,1,2,3,4,5,6,7,8,9,10,11,12,13,14,15 /home/nikro/projects/llama.cpp/build-vanilla/bin/llama-bench -m /home/nikro/projects/models/gpt-oss-20b-Q4_K_M.gguf -p 512 -n 0 -o json -t 16 ✓ 56.750169 t/s ✓ reports/2025-10-15-182000-exploratory/summary.md ...
We use it ourselves (and planning still to use it, once I get a proper PSU to handle an extra CPU EPS connection, and enable XMP on my RAM) - hope it will be useful for someone else where 🌎 - if you’re that someone, I’d appreciate a ⭐ on that repo 😅.
Results: 📈 What actually happened
Let’s talk about my exploratory → deep tests.
🔭 Exploratory:
We made 6 different builds:
- llama.cpp (vanilla) - simple default llama.cpp CPU build
- llama.cpp + BLAS
- llama.cpp + BLIS
- ik_llama.cpp - the specialized fork - vanilla
- ik_llama.cpp + BLIS
- ik_llama.cpp + additional flags - that I hoped would enable the FANCY SIMD, but they didn’t, and I also don’t know whether those flags had any influence on the performance of the build
Then we just targeted 2 different modes (after experimentation):
- with numactl enabled - and force everything to run on first 16 logic cores (having 1 process per 1 physical core) - aka all_cores_16t_01
- with numactl disabled - basically have it dynamic (but balance is still off - however it allows to run random 1st available cores) - aka no_node_16t
mode: exploratory repetitions: 2 model_path: /home/nikro/projects/models/gpt-oss-20b-Q4_K_M.gguf model_info: "gpt-oss-20b-Q4_K_M.gguf" # Builds to test - edit paths to match your setup builds: vanilla: binary: /home/nikro/projects/llama.cpp/build-vanilla/bin/llama-bench label: "vanilla (baseline)" blas: binary: /home/nikro/projects/llama.cpp/build-blas/bin/llama-bench label: "vanilla-BLAS" blis: binary: /home/nikro/projects/llama.cpp/build-blis/bin/llama-bench label: "vanilla-BLIS" ik_vanilla: binary: /home/nikro/projects/ik_llama.cpp/build-cpu/bin/llama-bench label: "IK-vanilla" ik_blis: binary: /home/nikro/projects/ik_llama.cpp/build-blis/bin/llama-bench label: "IK-BLIS" ik_fancy: binary: /home/nikro/projects/ik_llama.cpp/build-fancy/bin/llama-bench label: "IK-fancy" # Which builds to include in this run builds_select: - vanilla - blas - blis - ik_vanilla - ik_blis - ik_fancy # Test matrix - exploratory sweep across different NUMA strategies # Threadripper 1950X: 16 physical cores (0-15), 32 logical (16-31 are SMT siblings) test_matrix: # Test 1: All 16 physical cores, 16 threads - name: "all_cores_16t_01" numactl: "-N 0,1 -m 0,1 --physcpubind=0,1,2,3,4,5,6,7,8,9,10,11,12,13,14,15" env: OMP_NUM_THREADS: "16" extra_args: "-t 16" # Test 2: No NUMA - name: "no_node_16t" numactl: "" env: OMP_NUM_THREADS: "16" extra_args: "-t 16" # Standard llama-bench metrics metrics: - pp512 # Prompt processing: 512 tokens - tg128 # Text generation: 128 tokens - mixed # Prompt=512 + Generate=128 # Output directory output_dir: ./reports
Results are:
.png)
Raws:
# Benchmark Summary - Exploratory **Date:** 2025-10-15 20:29:40 **Config:** configs/qb-exploratory.yaml **Model:** gpt-oss-20b-Q4_K_M.gguf ## PP512 | Build | Config | t/s (our reps) | llama-bench σ | Reps | |:-----------|:-----------------|:-----------------|:----------------|-------:| | ik_vanilla | all_cores_16t_01 | 91.91 ± 0.06 | ±0.17 | 2 | | ik_fancy | all_cores_16t_01 | 91.40 ± 0.17 | ±0.22 | 2 | | ik_fancy | no_node_16t | 89.14 ± 1.37 | ±3.11 | 2 | | ik_vanilla | no_node_16t | 86.80 ± 4.23 | ±8.05 | 2 | | vanilla | all_cores_16t_01 | 56.82 ± 0.07 | ±0.17 | 2 | | vanilla | no_node_16t | 56.74 ± 0.18 | ±0.25 | 2 | | blas | no_node_16t | 50.40 ± 0.81 | ±0.81 | 2 | | blas | all_cores_16t_01 | 38.58 ± 0.03 | ±0.18 | 2 | | blis | no_node_16t | 31.79 ± 0.02 | ±0.08 | 2 | | blis | all_cores_16t_01 | 31.66 ± 0.01 | ±0.19 | 2 | | ik_blis | all_cores_16t_01 | 27.41 ± 0.03 | ±0.09 | 2 | | ik_blis | no_node_16t | 25.90 ± 0.64 | ±0.95 | 2 | ## TG128 | Build | Config | t/s (our reps) | llama-bench σ | Reps | |:-----------|:-----------------|:-----------------|:----------------|-------:| | ik_blis | no_node_16t | 18.14 ± 0.49 | ±0.17 | 2 | | ik_vanilla | no_node_16t | 18.05 ± 0.51 | ±0.29 | 2 | | ik_vanilla | all_cores_16t_01 | 17.03 ± 0.99 | ±0.48 | 2 | | ik_blis | all_cores_16t_01 | 16.72 ± 0.48 | ±0.25 | 2 | | ik_fancy | all_cores_16t_01 | 16.01 ± 1.88 | ±0.69 | 2 | | ik_fancy | no_node_16t | 15.99 ± 2.01 | ±0.10 | 2 | | vanilla | all_cores_16t_01 | 15.55 ± 0.01 | ±0.01 | 2 | | blis | all_cores_16t_01 | 15.47 ± 0.06 | ±0.02 | 2 | | vanilla | no_node_16t | 14.30 ± 0.03 | ±0.04 | 2 | | blas | no_node_16t | 13.25 ± 0.22 | ±0.22 | 2 | | blas | all_cores_16t_01 | 13.19 ± 0.86 | ±0.10 | 2 | | blis | no_node_16t | 12.27 ± 0.02 | ±0.09 | 2 | ## MIXED | Build | Config | t/s (our reps) | llama-bench σ | Reps | |:-----------|:-----------------|:-----------------|:----------------|-------:| | ik_vanilla | all_cores_16t_01 | 91.66 ± 0.02 | ±0.23 | 2 | | ik_fancy | all_cores_16t_01 | 91.40 ± 0.04 | ±0.33 | 2 | | ik_vanilla | no_node_16t | 79.63 ± 4.12 | ±13.58 | 2 | | ik_fancy | no_node_16t | 73.54 ± 12.04 | ±8.76 | 2 | | vanilla | all_cores_16t_01 | 56.95 ± 0.02 | ±0.12 | 2 | | vanilla | no_node_16t | 56.80 ± 0.05 | ±0.13 | 2 | | blas | no_node_16t | 50.13 ± 0.37 | ±0.81 | 2 | | blas | all_cores_16t_01 | 38.48 ± 0.02 | ±0.18 | 2 | | blis | no_node_16t | 31.84 ± 0.01 | ±0.05 | 2 | | blis | all_cores_16t_01 | 31.76 ± 0.09 | ±0.15 | 2 | | ik_blis | all_cores_16t_01 | 27.41 ± 0.04 | ±0.07 | 2 | | ik_blis | no_node_16t | 26.34 ± 0.15 | ±0.65 | 2 | ---
Alright, here’s what we learned from this:
- Our custom ik_llama builds (i.e. ik_vanilla) - performs very well - on average 60-90% higher than normal vanilla builds.
- NUMA-aware execution boosts throughput - and at times, by a lot.
- TG128 (generation/decoding) - tells a bit a different story, so if you want that number higher no matter what, you might want to be interested in BLIS, but to be fair: ik_vanilla isn’t far behind (the variance might be the one that sets it apart).
Okay okay, let’s dive into a deeper analysis now that we know what we wanna focus on. The report btw generated a promoted.yml config - that we used as our basis - we did adjust it slightly:
mode: deep repetitions: 2 metrics: - pp512 - tg128 - mixed output_dir: ./reports builds: ik_vanilla: binary: /home/nikro/projects/ik_llama.cpp/build-cpu/bin/llama-bench label: IK-vanilla ik_fancy: binary: /home/nikro/projects/ik_llama.cpp/build-fancy/bin/llama-bench label: IK-fancy ik_blis: binary: /home/nikro/projects/ik_llama.cpp/build-blis/bin/llama-bench label: IK-BLIS builds_select: - ik_vanilla # - ik_fancy - skip this one, as I am not sure our flags do anything different. - ik_blis test_matrix: - name: all_cores_16t_01 numactl: -N 0,1 -m 0,1 --physcpubind=0,1,2,3,4,5,6,7,8,9,10,11,12,13,14,15 env: OMP_NUM_THREADS: '16' extra_args: -t 16 - name: no_node_16t numactl: '' env: OMP_NUM_THREADS: '16' extra_args: -t 16 model_path: /home/nikro/projects/models/gpt-oss-20b-Q4_K_M.gguf model_info: gpt-oss-20b-Q4_K_M.gguf # ============================================================================ # PARAMETER SWEEP (this is what makes "deep" mode deep!) # ============================================================================ parameter_sweep: # KV Cache Type Variations kv_cache: - name: "f16_f16" args: "-ctk f16 -ctv f16" # Baseline #- name: "f8_f16" # args: "-ctk q8_0 -ctv f16" # Quantize K cache (common optimization) # MLA/Attention Variants mla_variants: - name: "baseline" args: "" - name: "mla2_fa_fmoe" args: "-mla 2 -fa -fmoe" - name: "mla3_fa_fmoe" args: "-mla 3 -fa -fmoe" # Batch Size Variations batch_sizes: - name: "std" args: "-b 2048 -ub 512" - name: "small_128" args: "-b 256 -ub 128" - name: "small_64" args: "-b 256 -ub 64" - name: "mid" args: "-b 512 -ub 256"
I also ran this as 2 separate runs for different KV params - initially only f16/f16 (classic), and later the q8_0 / f16:
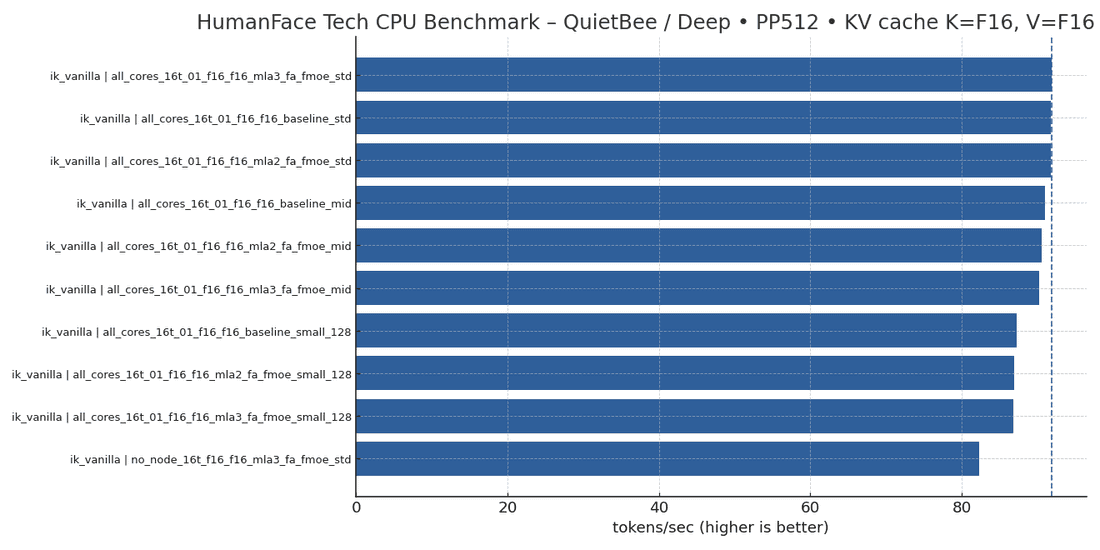
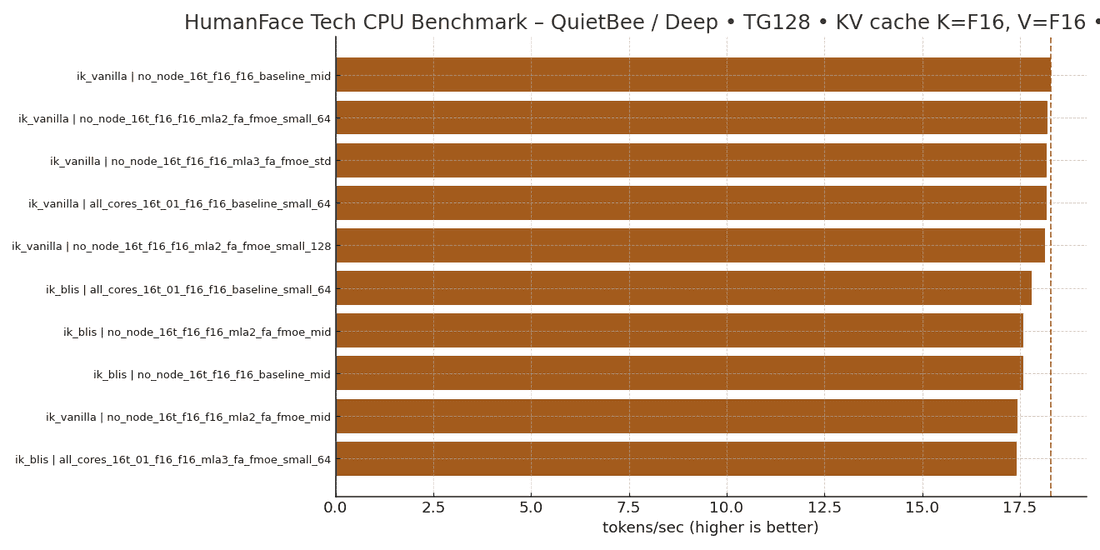
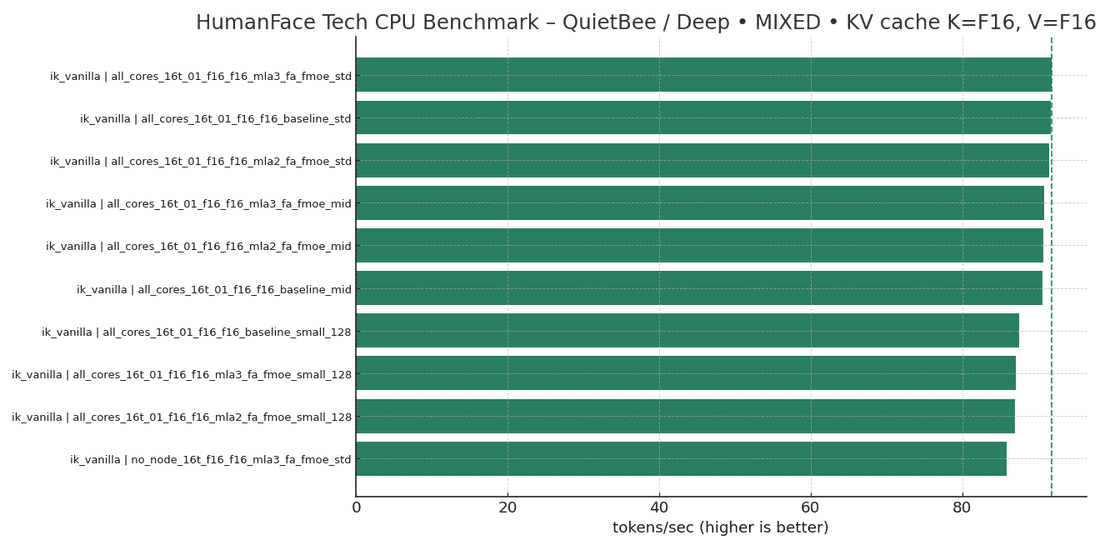
# PP512 — Top 10 (Deep) | Build | Config | t/s | σ | |------------|--------------------------------------------------|-----|--------| | ik_vanilla | all_cores_16t_01_f16_f16_mla3_fa_fmoe_std | 91.83 | ±0.27 | | ik_vanilla | all_cores_16t_01_f16_f16_baseline_std | 91.71 | ±0.41 | | ik_vanilla | all_cores_16t_01_f16_f16_mla2_fa_fmoe_std | 91.70 | ±0.27 | | ik_vanilla | all_cores_16t_01_f16_f16_baseline_mid | 91.02 | ±0.22 | | ik_vanilla | all_cores_16t_01_f16_f16_mla2_fa_fmoe_mid | 90.59 | ±0.24 | | ik_vanilla | all_cores_16t_01_f16_f16_mla3_fa_fmoe_mid | 90.23 | ±0.28 | | ik_vanilla | all_cores_16t_01_f16_f16_baseline_small_128 | 87.20 | ±0.43 | | ik_vanilla | all_cores_16t_01_f16_f16_mla2_fa_fmoe_small_128 | 86.91 | ±0.24 | | ik_vanilla | all_cores_16t_01_f16_f16_mla3_fa_fmoe_small_128 | 86.81 | ±0.26 | | ik_vanilla | no_node_16t_f16_f16_mla3_fa_fmoe_std | 82.26 | ±13.91 | …others removed for brevity… # TG128 — Top 10 (Deep) | Build | Config | t/s | σ | |------------|--------------------------------------------------|-----|--------| | ik_vanilla | no_node_16t_f16_f16_baseline_mid | 18.28 | ±0.18 | | ik_vanilla | no_node_16t_f16_f16_mla2_fa_fmoe_small_64 | 18.21 | ±0.10 | | ik_vanilla | all_cores_16t_01_f16_f16_baseline_small_64 | 18.18 | ±0.24 | | ik_vanilla | no_node_16t_f16_f16_mla3_fa_fmoe_std | 18.18 | ±0.22 | | ik_vanilla | no_node_16t_f16_f16_mla2_fa_fmoe_small_128 | 18.15 | ±0.12 | | ik_blis | all_cores_16t_01_f16_f16_baseline_small_64 | 17.80 | ±0.43 | | ik_blis | no_node_16t_f16_f16_baseline_mid | 17.58 | ±0.23 | | ik_blis | no_node_16t_f16_f16_mla2_fa_fmoe_mid | 17.58 | ±0.32 | | ik_vanilla | no_node_16t_f16_f16_mla2_fa_fmoe_mid | 17.43 | ±0.09 | | ik_blis | all_cores_16t_01_f16_f16_mla3_fa_fmoe_small_64 | 17.42 | ±0.23 | …others removed for brevity… # MIXED — Top 10 (Deep) | Build | Config | t/s | σ | |------------|--------------------------------------------------|-----|--------| | ik_vanilla | all_cores_16t_01_f16_f16_mla3_fa_fmoe_std | 91.76 | ±0.25 | | ik_vanilla | all_cores_16t_01_f16_f16_baseline_std | 91.63 | ±0.36 | | ik_vanilla | all_cores_16t_01_f16_f16_mla2_fa_fmoe_std | 91.49 | ±0.19 | | ik_vanilla | all_cores_16t_01_f16_f16_mla3_fa_fmoe_mid | 90.82 | ±0.30 | | ik_vanilla | all_cores_16t_01_f16_f16_mla2_fa_fmoe_mid | 90.71 | ±0.36 | | ik_vanilla | all_cores_16t_01_f16_f16_baseline_mid | 90.54 | ±0.23 | | ik_vanilla | all_cores_16t_01_f16_f16_baseline_small_128 | 87.49 | ±0.19 | | ik_vanilla | all_cores_16t_01_f16_f16_mla3_fa_fmoe_small_128 | 87.10 | ±0.28 | | ik_vanilla | all_cores_16t_01_f16_f16_mla2_fa_fmoe_small_128 | 86.98 | ±0.30 | | ik_vanilla | no_node_16t_f16_f16_mla3_fa_fmoe_std | 85.80 | ±7.81 | …others removed for brevity…


Great - so what about quantizing the K in KV: q8_0 / f16? It does make a model slightly worse (≤1%) - so keep that in mind:
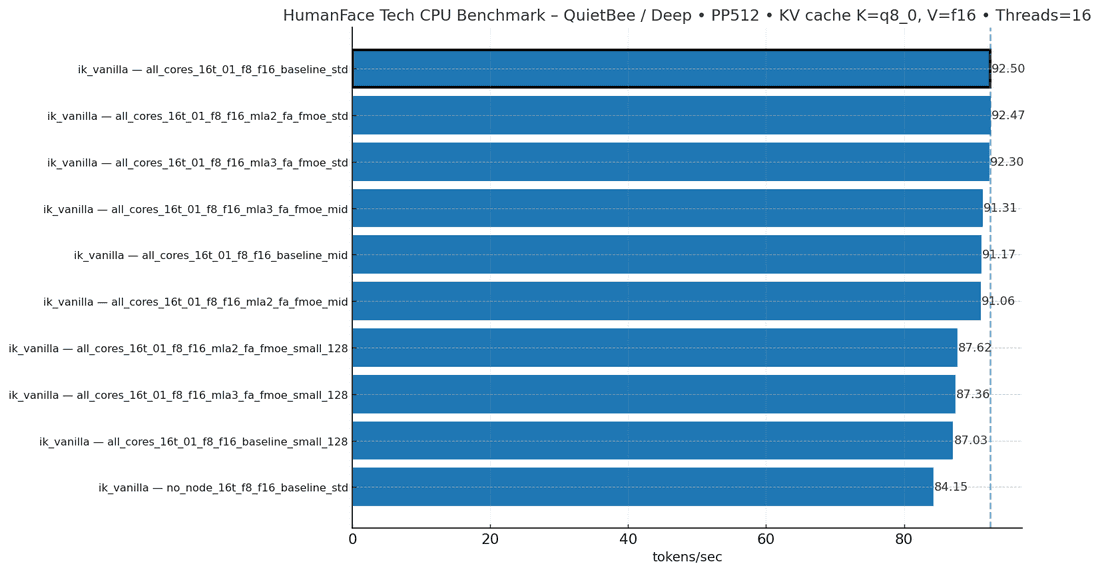
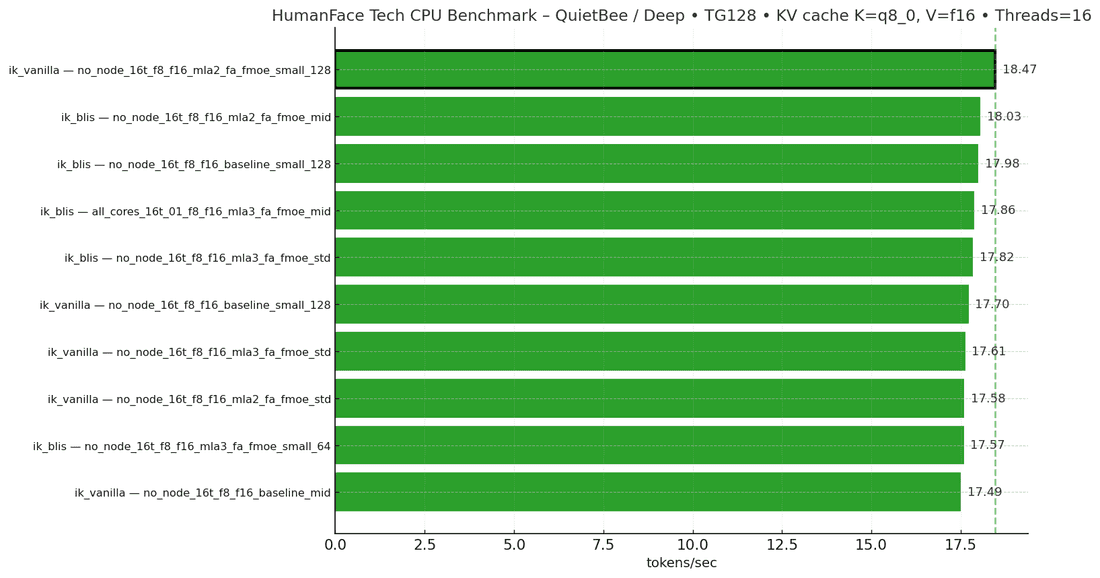
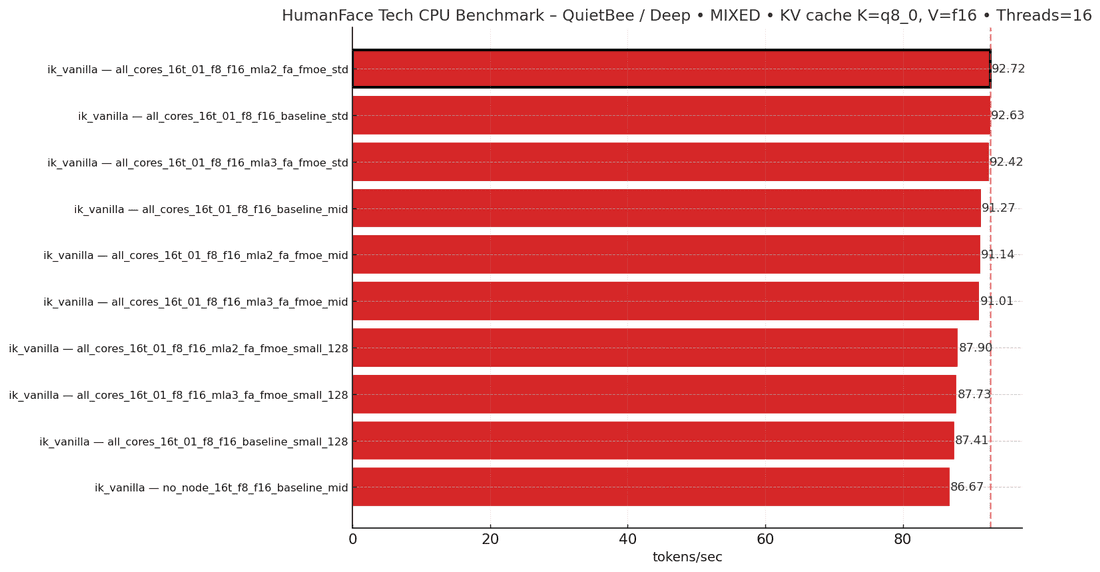
## PP512 (top 10) 1) ik_vanilla — all_cores_16t_01_f8_f16_baseline_std — 92.50 t/s 2) ik_vanilla — all_cores_16t_01_f8_f16_mla2_fa_fmoe_std — 92.47 t/s 3) ik_vanilla — all_cores_16t_01_f8_f16_mla3_fa_fmoe_std — 92.30 t/s 4) ik_vanilla — all_cores_16t_01_f8_f16_mla3_fa_fmoe_mid — 91.31 t/s 5) ik_vanilla — all_cores_16t_01_f8_f16_baseline_mid — 91.17 t/s 6) ik_vanilla — all_cores_16t_01_f8_f16_mla2_fa_fmoe_mid — 91.06 t/s 7) ik_vanilla — all_cores_16t_01_f8_f16_mla2_fa_fmoe_small_128 — 87.62 t/s 8) ik_vanilla — all_cores_16t_01_f8_f16_mla3_fa_fmoe_small_128 — 87.36 t/s 9) ik_vanilla — all_cores_16t_01_f8_f16_baseline_small_128 — 87.03 t/s 10) ik_vanilla — no_node_16t_f8_f16_baseline_std — 84.15 t/s … others removed for brevity … ## TG128 (top 10) 1) ik_vanilla — no_node_16t_f8_f16_mla2_fa_fmoe_small_128 — 18.47 t/s 2) ik_blis — no_node_16t_f8_f16_mla2_fa_fmoe_mid — 18.03 t/s 3) ik_blis — no_node_16t_f8_f16_baseline_small_128 — 17.98 t/s 4) ik_blis — all_cores_16t_01_f8_f16_mla3_fa_fmoe_mid — 17.86 t/s 5) ik_blis — no_node_16t_f8_f16_mla3_fa_fmoe_std — 17.82 t/s 6) ik_vanilla — no_node_16t_f8_f16_baseline_small_128 — 17.70 t/s 7) ik_vanilla — no_node_16t_f8_f16_mla3_fa_fmoe_std — 17.61 t/s 8) ik_vanilla — no_node_16t_f8_f16_mla2_fa_fmoe_std — 17.58 t/s 9) ik_blis — no_node_16t_f8_f16_mla3_fa_fmoe_small_64 — 17.57 t/s 10) ik_vanilla — no_node_16t_f8_f16_baseline_mid — 17.49 t/s … others removed for brevity … ## MIXED (top 10) 1) ik_vanilla — all_cores_16t_01_f8_f16_mla2_fa_fmoe_std — 92.72 t/s 2) ik_vanilla — all_cores_16t_01_f8_f16_baseline_std — 92.63 t/s 3) ik_vanilla — all_cores_16t_01_f8_f16_mla3_fa_fmoe_std — 92.42 t/s 4) ik_vanilla — all_cores_16t_01_f8_f16_baseline_mid — 91.27 t/s 5) ik_vanilla — all_cores_16t_01_f8_f16_mla2_fa_fmoe_mid — 91.14 t/s 6) ik_vanilla — all_cores_16t_01_f8_f16_mla3_fa_fmoe_mid — 91.01 t/s 7) ik_vanilla — all_cores_16t_01_f8_f16_mla2_fa_fmoe_small_128 — 87.90 t/s 8) ik_vanilla — all_cores_16t_01_f8_f16_mla3_fa_fmoe_small_128 — 87.73 t/s 9) ik_vanilla — all_cores_16t_01_f8_f16_baseline_small_128 — 87.41 t/s 10) ik_vanilla — no_node_16t_f8_f16_baseline_mid — 86.67 t/s … others removed for brevity …
Or visually 📊:


So, we can conclude:
- K-quantization gives a small but consistent speed bump.
- MIXED best improved from ~91.7 t/s (f16/f16) to ~92.7 t/s (q8_0/f16), roughly +1%.
- PP512 (prefill/input) moved from ~91.8 to ~92.5 t/s (+0.7%). TG128 best nudged up from ~18.3 to ~18.5 t/s.
- The “all_cores_16t_01 + ik_vanilla” family still dominates PP512 and MIXED. Whether baseline or with MLA/FA/FMoE toggled, those variants occupy the top slots. The feature flags don’t change ranking much → gains are within ~0–1%.
- TG128 (generation/decoding) remains more sensitive to pinning and small-batch configs. Top TG128 entries skew toward no_node_16t and “small_128/64” variants (both ik_vanilla and ik_blis show up), suggesting generation kernels benefit from tight per-token work and sometimes less aggressive NUMA/pinning.
🥇 Our “everyday” preset (and why)
After running multiple rounds of deep CPU benchmarking - hundreds of iterations with different kernel builds, memory pinning strategies, attention implementations, KV cache types, and batching configurations → we can now confidently say we’ve found the sweet spot. This is the setup that delivers top-tier performance across all workload types without sacrificing model quality.
- Build:
ik_vanilla
(the ik_llama.cpp - fork, with default settings) - Threads: 16 (pinned across NUMA nodes, e.g.
numactl --physcpubind=0-15
) - KV Cache: default (which is f16/f16)
- Flags:
-fa -fmoe -mla 2
(fast attention, fused MoE, modern linear algebra optimizations) - Batching: standard
- Execution profile: NUMA balanced, threads pinned, page locality enforced
This single configuration emerged as the most consistent and balanced across all three benchmark dimensions we care about:
- PP512 (prompt processing):
- 🚀 ~91.7 t/s - within 0.2 % of the absolute best run.
- 📈 +61–62 % faster than vanilla (which averages ~56.8 t/s).
- TG128 (generation):
- ⚡ ~17.0 t/s - only ~3 % slower than the most extreme TG-optimized build.
- 📈 ~12–14 % faster than vanilla (~15.0–15.2 t/s).
- MIXED:
- 🔥 ~91.6–91.8 t/s - best overall throughput when simulating realistic multi-stage workloads.
- 📈 ~61 % faster than vanilla (~56.8 t/s).
🧭 Closing thoughts
I think, it was a pretty good ride we took - we can now restrict some params, swap the model and check again. Or, we can install new PSU or 1 more RAM stick, and try again. I think general rules should translate (and stick to the CPU+RAM setup) - but the result of the ride - is the repo → wrapper around llama-bench that can (in few hours) give us a nice & solid comparison table - is 🔥
If you’re curious - feel free to explore and use the tool - and test things yourself - I’d love to hear what results you encountered, leave a comment 👇.
Also please consider supporting our effort on - Ko-Fi - any donation will go straight into the GPU budget and more articles → https://ko-fi.com/nikrosergiu
And, if you want to get in-touch for some projects - check out HumanFace Tech and book a meeting.
💡 Inspired by this article?
If you found this article helpful and want to discuss your specific needs, I'd love to help! Whether you need personal guidance or are looking for professional services for your business, I'm here to assist.
Comments:
Feel free to ask any question / or share any suggestion!